Kicka$$ In-Cell Graphs: No 1
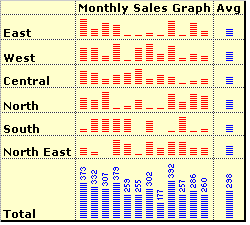
 Eversince I discovered about Incell graphs in Juice Analytics sometime back, I was itching to use them and develop something fun, intuitive and easy. Work kept me buys for most of the last week, so I couldnt come up with something unique and simple till late yesterday. So here is something that I have come up with.
Using In-cell graphs to depict micro charts:
- Learn how to create In-cell graphs at Juice Analytics. [Download Excel In-cell Graph Ideas from Juice Analytics]Its simple. If you have a monthly sales figure or someother number then you can convert it into incell graph using Rept() function.
For example:
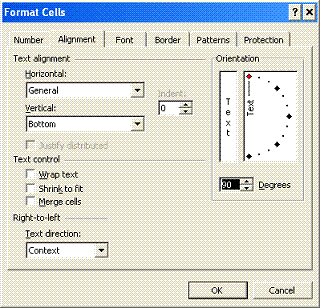
Rept("#", 20) would result in #################### - But Incell graphs are by default horizontal. Well, thats where you use text orientation feature of Excel. Goto Format->Cells->Alignment Tab. Change the orientation for the cells to 90 Degrees like shown here. You can display incell charts vertically now.

- Essentially what you need to do to get something similar to the topmost figure is:
--- Create Rept("|", monthly_sales_value OR something_else)
--- Concatenate the results in to one cell along with Carriage return between each value (Quick tip on howto: "a" & char(10) & "b" will return the formula result in 2 lines; that is if you enable wrap text)
--- Format the text to orient vertically
- Playing with In-cell graphs: You can concatenate total values on the top of each graph, you can show average sales, max sales, min sales in seperate columns or together with "AVG", "MIN", "MAX" added in the end of the bar. If bars are too lengthy / small, you can divide or multiple with a constant. So on... [Download Excel In-cell Graph Ideas from Juice Analytics]
Remember: If you dont enable "Wrap Text" you wont get the desired effect.
Type: Tutorial, Graphs, Visualization, Data Representation
Applicability: To get that extra WOW effect, raise a few eye brows in conference rooms, Printed reports, Where data is more and graphs become useless
Excel Knowledge Required: Low to Medium
Ease of Implementation: Simple

2 Comments:
In this article we shall be discussing about
the various ways in which one can make as much profits as
maybe possible and how we can select securities to make
investments. Investing in securities can be profitable only
if investment is done with proper research
By sharetipsinfo, at 10/20/2011 04:06:00 AM
After getting butchered in last two sessions, the market has opened in green territory. The Sensex is up 92.65 points at 20321.70, and the Nifty is up 29.85 points at 6028.90.
Moneycontrol
Moneycontroltips
By PraniShah, at 11/21/2013 09:39:00 PM
Post a Comment
<< Home